Reports & Charts Integration for monday.com
Reports & Charts Integration for monday.com
Get this app to add reports and charts to your monday.com dashboards and display statistics of your boards.
Once it's installed, you can start using the app right away from your Dashboards with a simple configuration.
Adding the app to your Dashboard
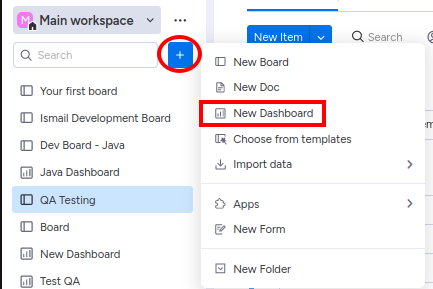
1. As a first step, if you haven’t already, create a Dashboard in your monday workspace:
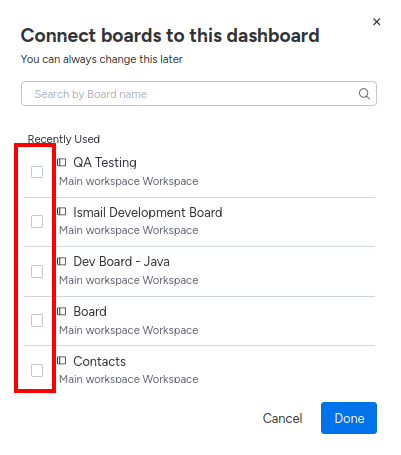
2. Select one or multiple boards and click "Done".
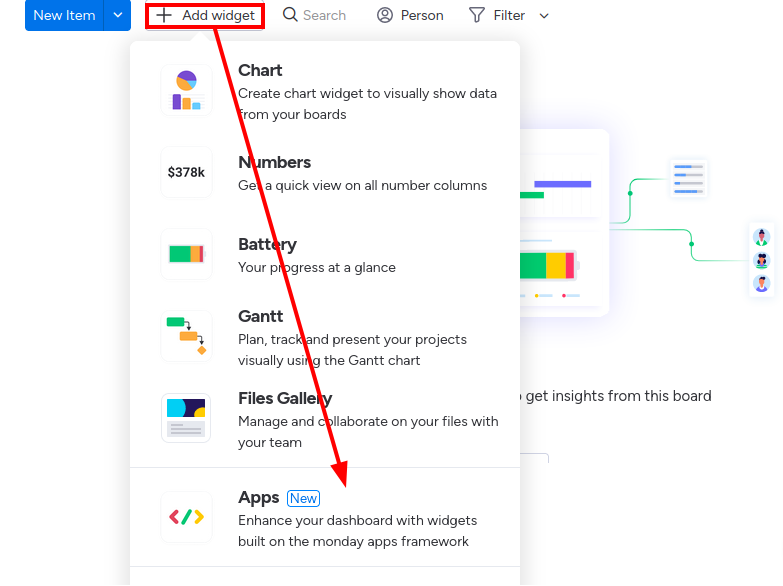
3. On the Dashboard, click “Add widget” and choose “Apps” from the menu:
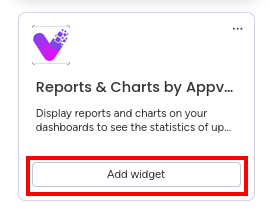
3. Under “Installed Apps” find Reports & Charts by Appvibe” and click “Add widget”
4. With this, you have successfully added the app to your Dashboard
Customizing the Reports & Charts
-
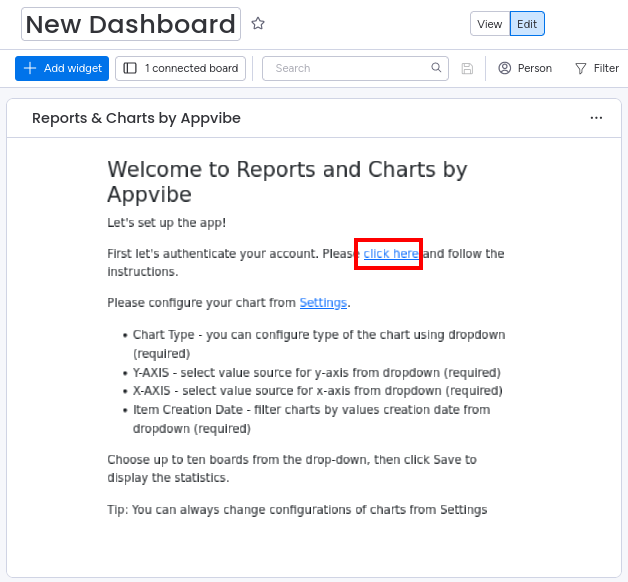
First, you need to authorize your account to start using the app. Click on the first link and follow the instructions.
-
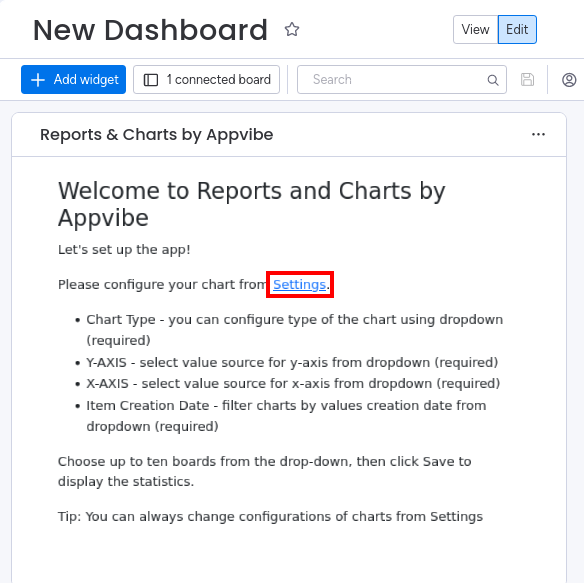
After this, click on “Settings” to set up your report.
-
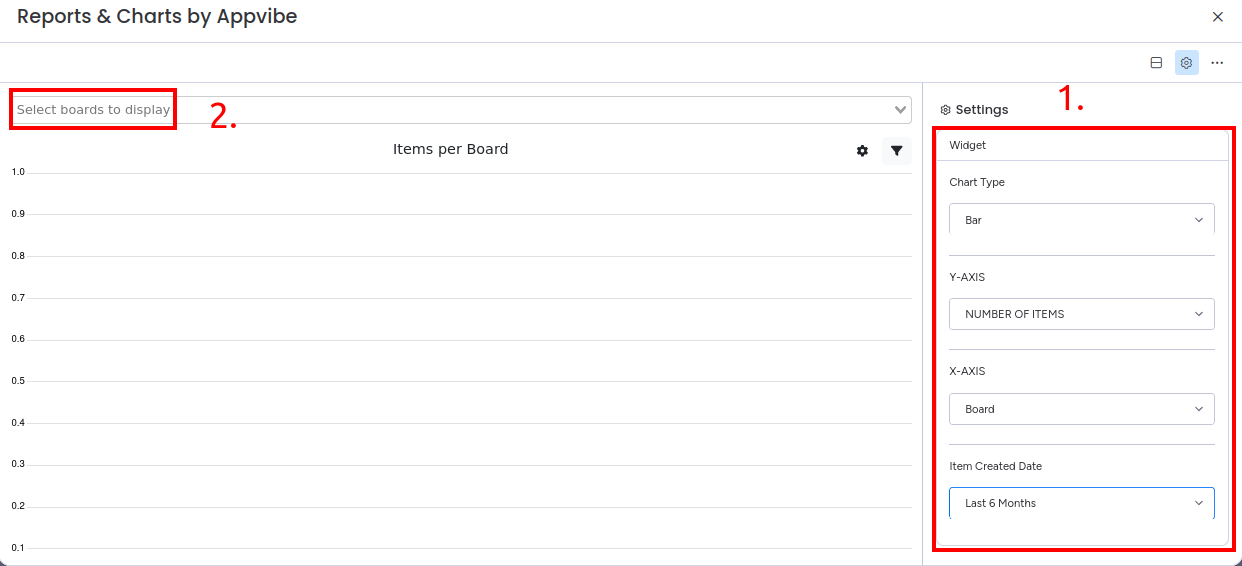
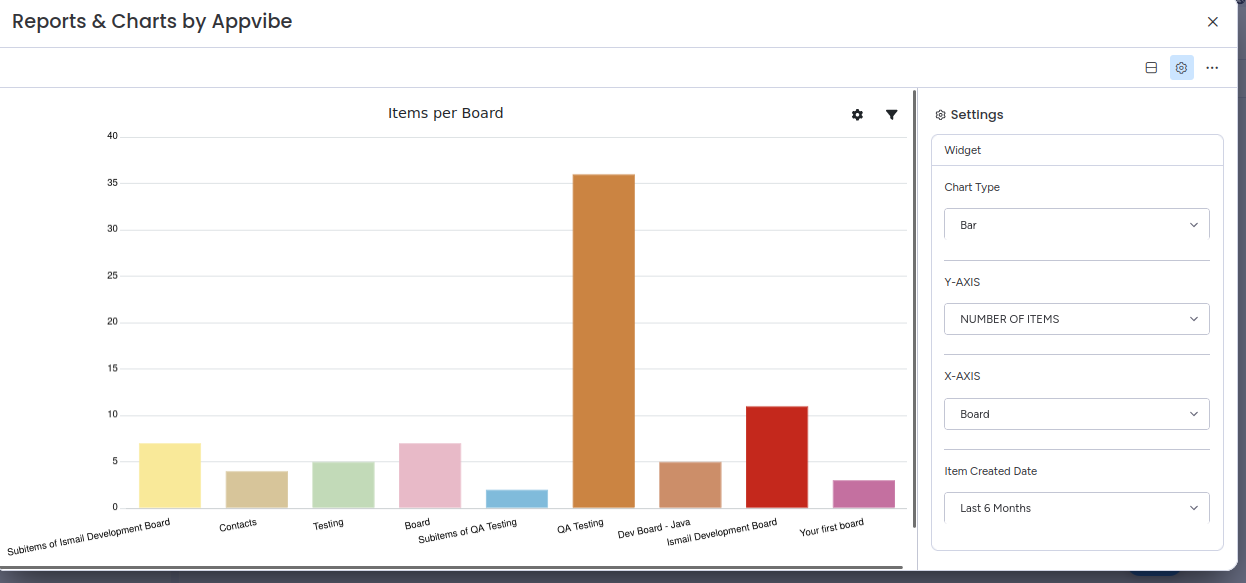
Here, first fill out the “Chart Type”, “Y-Axis”, “X-Axis”, and “Item Created Date” for your desired report. You need to do this first, then you will be able to select the boards.
-
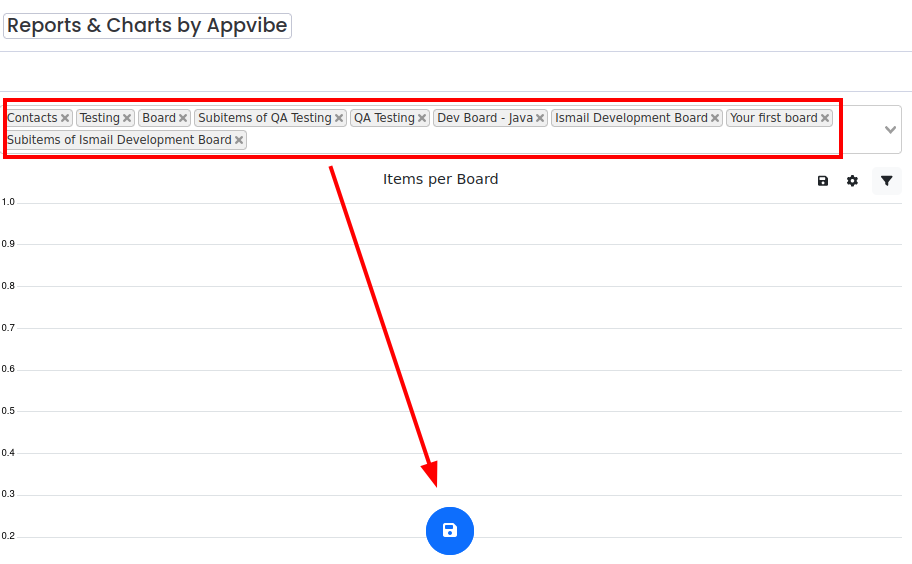
After this, select up to ten boards to display from the top drop-down.
-
Finally, click the save button on the top or at the bottom to finalize the report.


You can open the Settings page from the three vertical dots as well. With this feature, you can easily change the report at any time.
If you need any help with our app, or if you have any suggestions for us to make it better, please get in touch with our support team. We will be more than happy to help.
Release Notes
2023-04-07
-
Initial release
2023-06-22
-
Changes to number of boards displayed
-
Added extra save button
No Comments