Reports & Chart by Appvibe - Dashboard Gadget for Jira
Reports & Chart Dashboard Gadget for Jira
Get this app to add reports and charts to your Jira dashboards and display statistics of your Jira tickets and projects.
Once it's installed, you can start using the app right away from your Dashboards with a simple configuration.
Adding the app to your Dashboard
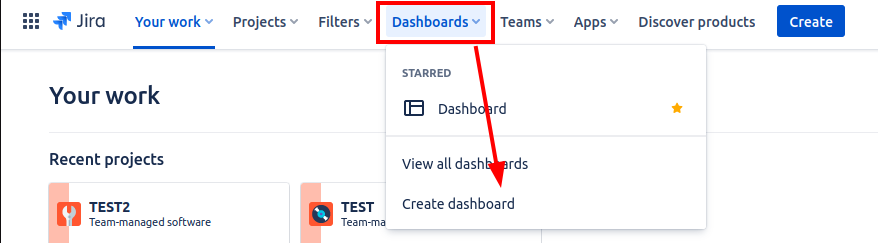
- As a first step, if you haven’t already, create a Dashboard in your Jira instance by going to Dashboards - Create dashboard
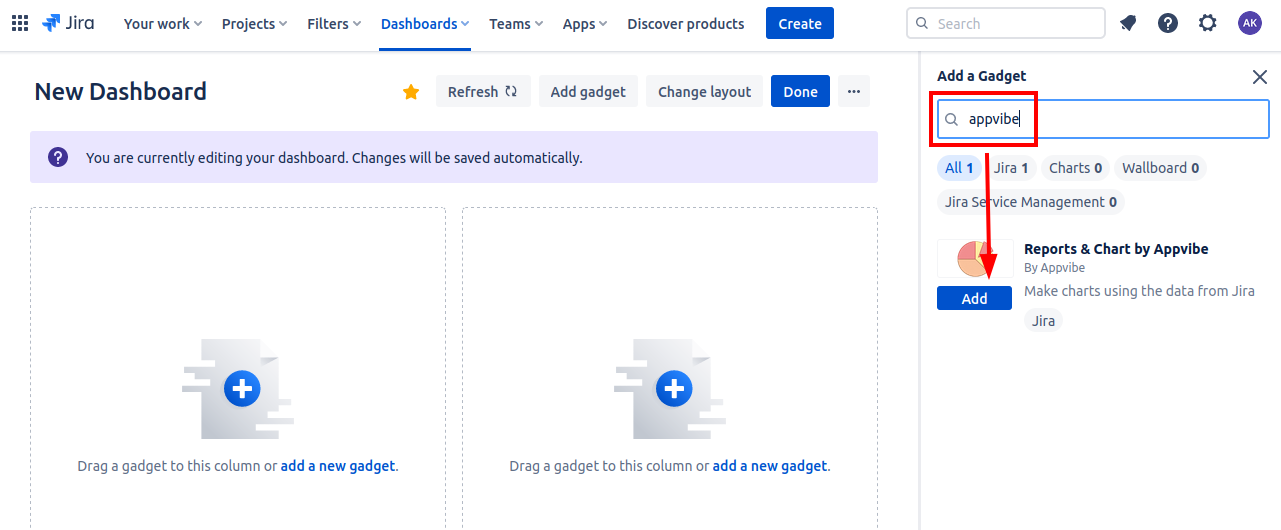
- Once on the Dashboard, search in the Gadgets section for "Appvibe" then click on the "Add" button


Configuring the app
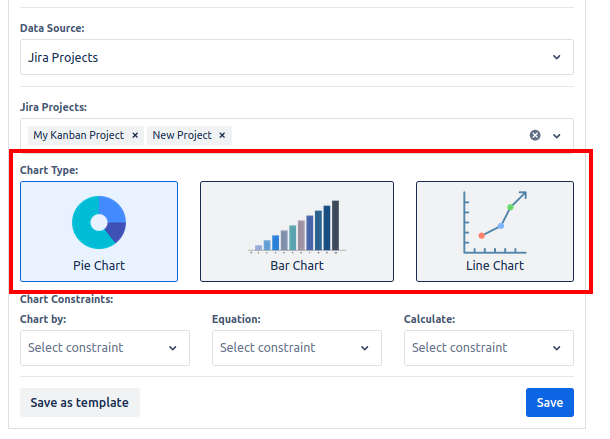
- First, select the Jira projects you would like to use.
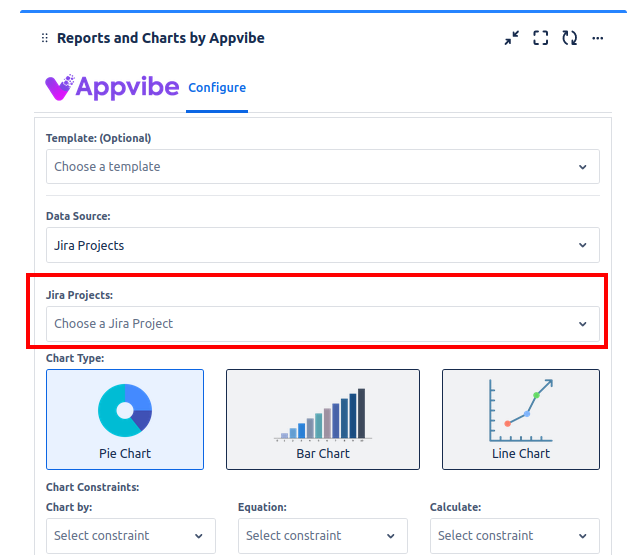
- Then select the chart type. You can choose between a Pie Chart, a Bar Chart and a Line Chart.

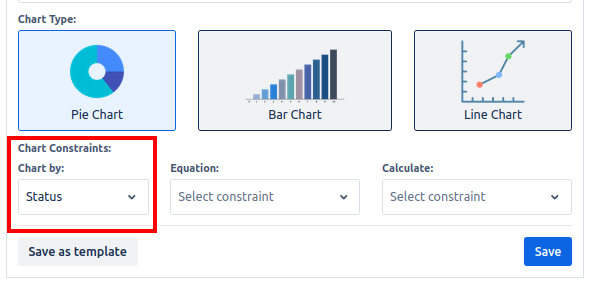
- After that, select the main constraint of the app in the "Chart by" dropdown. This field takes the options from your Jira projects, so the options will be slightly different from account to account.

- Then, fill out the "Equation" and "Calculate" fields.
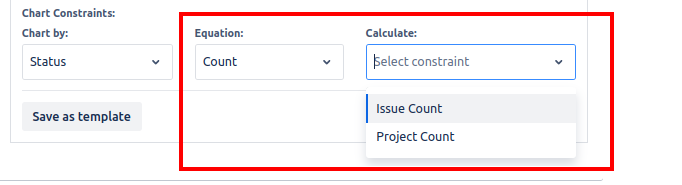
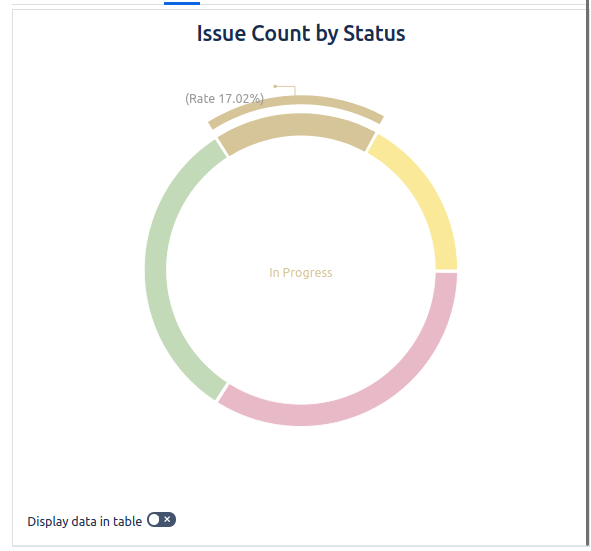
- Finally, click on the Save button to create the chart.


You can also save your chart settings as templates, and then later access them from the Template dropdown.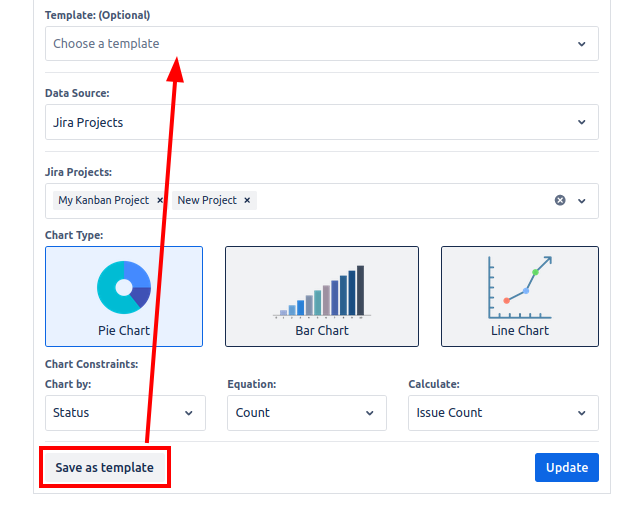
Frequently asked questions
Some team members get a "403" error. What should I do?
The most likely cause of this error is if someone without admin permissions is trying to add the app to a dashboard. Please note that this app is meant to be used by admin users. If someone is getting this error, please grant them admin permissions.
No Comments